 Labelly
Comparing Products Using Per 100 g Values
How to use consistent units for fair product comparison and why per 100 g values are more reliable than per-portion comparisons.
Why Per 100 g Comparison Matters
When comparing the nutritional composition of two products, using consistent units is essential. The per 100 grams (or per 100 millilitres for liquids) value provides a standardised measurement that allows fair comparison between any products, regardless of package size or manufacturer-declared portion size. This standardisation makes it possible to compare products from different brands in the same category on an equal basis.
The Problem with Per-Portion Comparisons
Per-portion values depend entirely on the manufacturer-declared serving size. Because different manufacturers declare different portion sizes for similar products, per-portion values are unreliable for comparison. For example:
- Cereal brand A declares a 30 g portion and shows 100 kcal per portion
- Cereal brand B declares a 40 g portion and shows 120 kcal per portion
Based on per-portion values, cereal A appears lower in energy. However, using per 100 g values:
- Brand A: 100 kcal ÷ 30 g × 100 = 333 kcal per 100 g
- Brand B: 120 kcal ÷ 40 g × 100 = 300 kcal per 100 g
The per 100 g comparison shows brand B is actually lower in energy. Portion sizes can be manipulated or simply reflect different manufacturers' recommendations, making per-portion comparison unreliable.
How to Calculate Per 100 g Values from Per-Portion Values
If you only have per-portion information and want to calculate per 100 g values, use this formula:
Per 100 g = (Per portion value ÷ Portion size in grams) × 100
For example, if a product shows 5 grams of fat per 40 g serving:
Per 100 g = (5 ÷ 40) × 100 = 12.5 grams of fat per 100 g
Practical Comparison Example
When comparing two yoghurt products:
| Product | Portion Size | Per Portion Sugar | Per 100g Sugar |
|---|---|---|---|
| Yoghurt A | 125 g | 8 g | 6.4 g |
| Yoghurt B | 100 g | 6 g | 6.0 g |
Per-portion comparison suggests yoghurt A has more sugar. Per 100 g comparison shows they are quite similar in sugar content (6.4 g vs 6.0 g). The per 100 g values provide a more accurate picture of the actual composition differences.
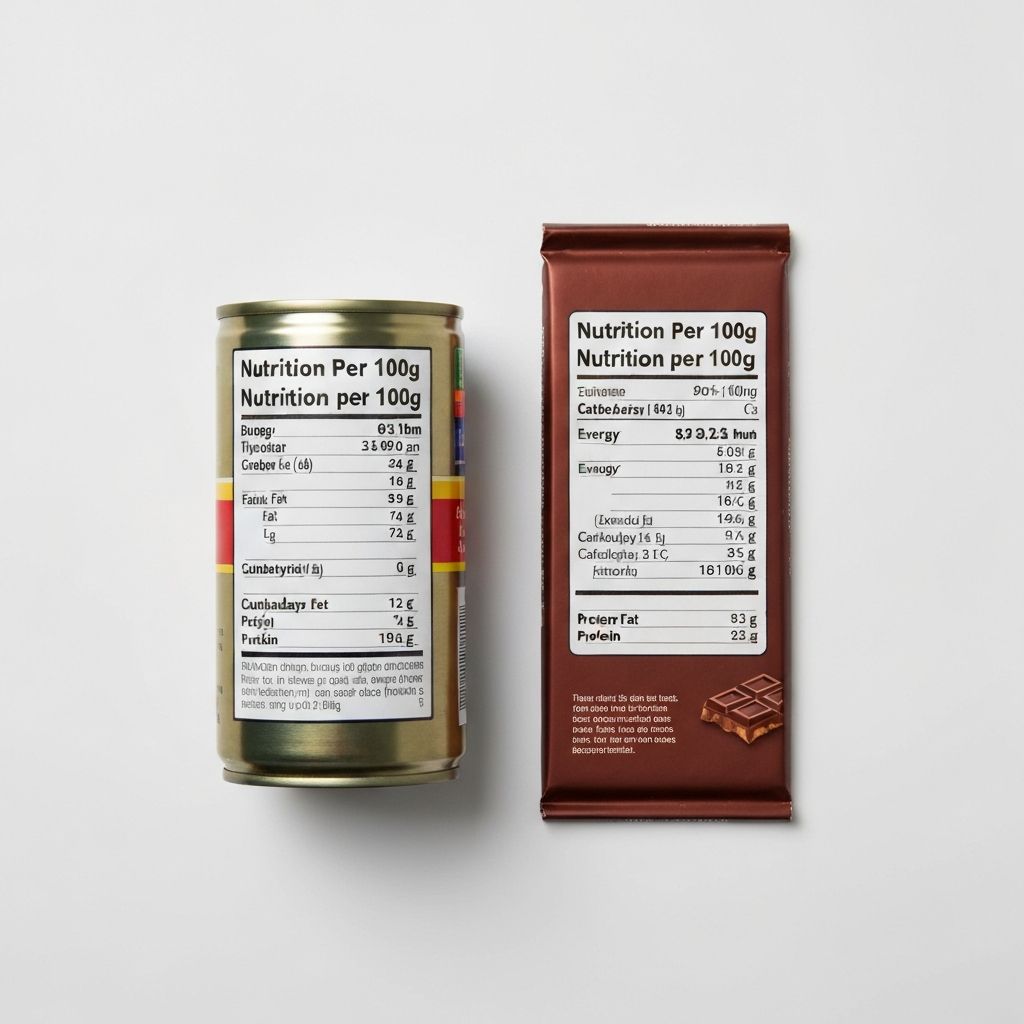
Comparing Across Different Package Sizes
The same product in different package sizes (single-serve, standard, family-size) often has different per-portion values listed because portion sizes are different. The per 100 g values will be identical across all package sizes of the same product. Using per 100 g comparison ensures you are comparing the actual product composition, not different portion interpretations.
Understanding Nutrient Density
Per 100 g values allow you to assess nutrient density – the amount of a nutrient relative to the product weight. A product with 15 grams of fat per 100 g is more fat-dense than a product with 10 grams of fat per 100 g. This information is independent of portion size and reflects the actual concentration of the nutrient in the product.
Energy Density Comparison
When comparing energy content, per 100 g values allow fair assessment of energy density. For example, when comparing different types of bread or biscuits, per 100 g comparison shows which is more energy-dense, regardless of how manufacturers have defined portion sizes. This is particularly useful for comparing products within the same category.
Context: Total Daily Intake
While per 100 g comparison provides accurate product composition information, understanding your total daily intake of nutrients requires considering all foods consumed. A product with 20 percent higher sugar per 100 g, for example, contributes differently to daily intake depending on how much you actually consume. Per 100 g values are useful for product comparison but should be considered alongside actual consumption amounts.
Traffic Light Labels and Per 100 g Basis
Traffic light labels colour-code nutrients based on their per 100 g values. This means traffic light comparison between products is reliable because all colours are based on consistent units. The per 100 g basis of traffic light labelling is one reason it is an effective point-of-purchase comparison tool.
Explore other labelling concepts
Discover additional detailed guides about UK food labelling systems and nutrition information presentation.
View all labelling explorations →